Download
All of the necessary data for all three tasks is available in a single 700 MB zip file:
https://doi.org/10.5281/zenodo.867646
The remote sensing data is stored in the RSdata folder of the archive with
subfolders for each datatype described below. Data for specific tasks is
available in folders named Task1, Task2, and Task3.
Datasets
Seven datasets will be used as part of this evaluation:
- Remote Sensing Data – 43 plots totalling ~1GB of imagery
- NEON Photographs - 0.0625 m2 resolution photographic images (RGB) in
ECODSEdataset/RSdata/camera - NEON LiDAR data - 3-dimensional point clouds of the height of trees and
ground in
ECODSEdataset/RSdata/pointCloud, which are also provided as 1 m2 resolution raster images of the estimated height of vegetation above the ground (Canopy Height Model; CHM) inECODSEdataset/RSdata/chm. - NEON Hyperspectral images - 1 m2 resolution raster images with 426
wavelength bands from 380-2510 nm in
ECODSEdataset/RSdata/hs. These data are georectified and atmospherically corrected, and bands that are strongly influenced by the absorbance by atmospheric water (and should be removed in most cases) will be specified.
- NEON Photographs - 0.0625 m2 resolution photographic images (RGB) in
- Ground Data – 88 trees
- NEON Vegetation Structure data - Ground based positions of individual trees, the size of each trunk, and for some trees two measurements of crown size (maximum crown diameter and the diameter of the crown perpendicular to the axis of the maximum diameter)
- NEON Species Data - the genus and species (type) of each tree
- Individual Tree Crown segmentations (ITC) Data – 626 stems
- ITC data - Vector polygon data of tree crown boundaries and vector point data of trunk locations both mapped in the field directly onto remote sensing images. Boundaries and locations are drawn onto remote sensing images from the ground while observing the trees directly and then fine tuned to match clear crown edges in the images. The crown data include confidence scores qualitatively estimating the precision of the tree crown mapping.
- Correspondence between ITC crowns and ground stems Spatial data will be provided in the UTM 17N coordinate system. The projection can generally be ignored at this scale of analysis and x and y values treated as any standard grid. Figure 1 illustrates these core data types. All data collected by NEON are publicly available with open licenses. The subset of data needed for this DSE will be posted on the DSE website for download.
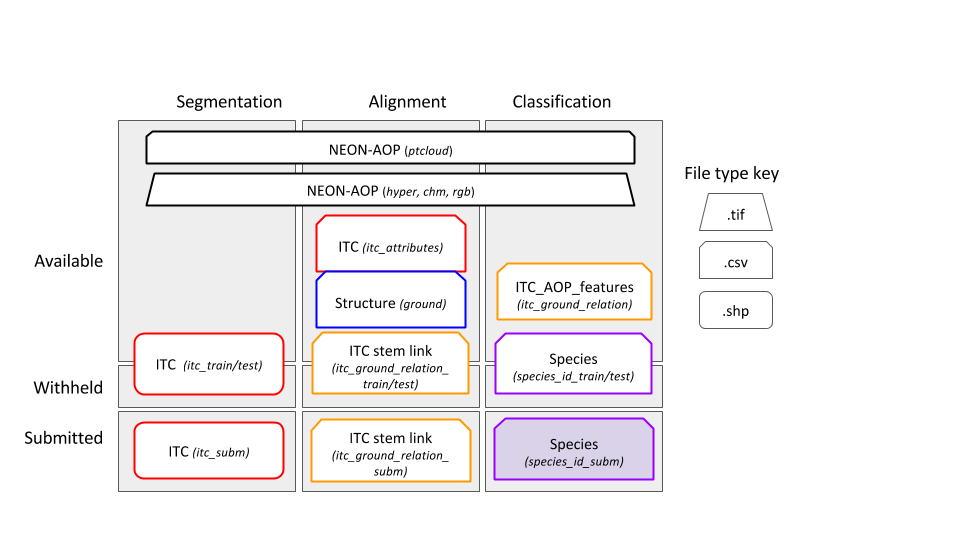
Figure 1. Example data products provided in the contest. Top row represents the remote sensing data: a) is the RGB image of a 80x80m plot, b) a CHM for the same region, c) a representation of the Hyperspectral data in false colors (a mixture of 3 hyperspectral bands; R = band 19, G = band 34, B = band 58). d) represents vectorial spatial data: green polygons ITCs collected for the area, black dots NEON ground data, dots’ size is scaled by tree DBH. Red ellipse represent expected crown area, given the widest crown diameter and its orthogonal one. e) is a sample of the attributes associated to ground data. f) is an example of spectral signature for a given hyperspectral pixel.
Location
All data is from the Ordway-Swisher Biological Station (OSBS) NEON site. Field measures and remote sensing data are for 23 OSBS NEON distributed plots (1600 m2) and 20 OSBS NEON tower plots (1600 m2), which include hardwood/woody wetlands and upland pine/sandhill ecosystems.
Input/Output data types for each tasks
The segmentation task uses the remote sensing data and 70% of ITC stem data for training and 30% of the ITC stem data for testing. The alignment task uses the remote sensing data, the ITC data, and ground data on stem diameter, height, and location. This task uses only trees whose ITCs are in the training set of the segmentation task with 70% of those stems used for training and 30% for testing. The classification task uses the subset of remote sensing pixels falling within the ITC-stem polygons. Data are in tabular form, with each row representing a pixel of the remote sensing data. Features for each pixel include ID, height, and reflectance for the 426 hyperspectral bands. A different csv file contains species identification for 70% of the ITCs for which species has been identified. The remaining 30% of species identification data is held as testing.
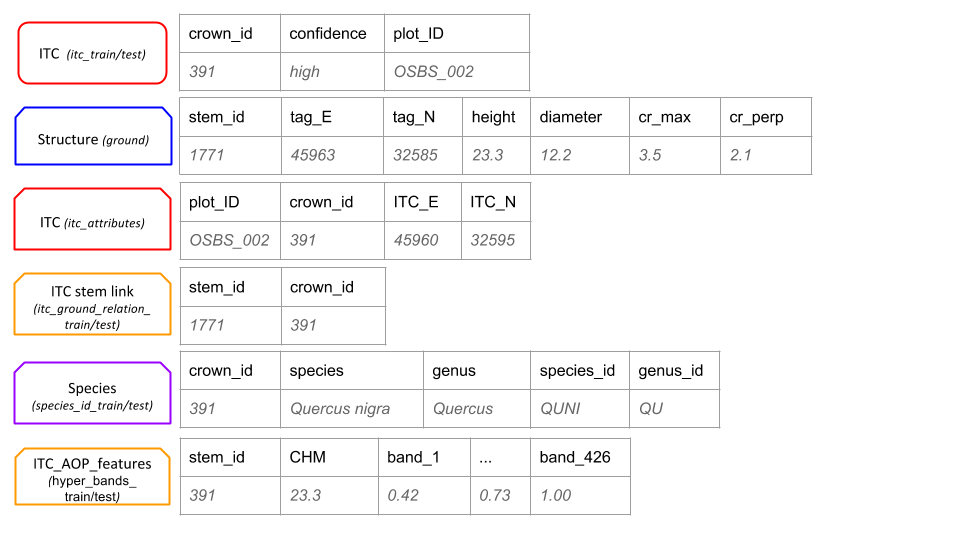
Figure 2: Training/testing Input/output data types for each of the three tasks. Data in both the train and test boxes will be split either at the plot level (segmentation and alignment tasks) on the stem level with 70% of the plots/stems used for training and 30% for testing. Products to be submitted are for the test data.Names in italics correspond to the names of the files provided or to be submitted. NEON-AOP (black): Spatial data of the 4 types of NEON-AOP data. ITC (red): Spatial data of Individual Tree Crowns and a unique crown ID number. ITC stem link (orange): Table of unique crown ID number and the NEON ground data stem ID number. Structure (blue): Table of NEON ground data with tree stem attributes; unique stem ID, latitude & longitude coordinates, stem diameter, crown dimensions. Species (purple): Table of NEON ground data with assignment to two class categories (species class and genus class). Species product is a table of the probability of assignment of each ITC for each class in both class categories.